
With Eulogica Dashboard, your key performance indicators are always available and up to date. This provides the knowledge you need to take the best possible decisions. Dashboards can be configured according to your needs—and are available for the desktop, for your tablet and even on your phone.
Many categories of information are entered to Eulogica; about burials and cremations, transport and sundry orders, how time is spent and revenue generated, details of invoices and payments. Over time, this becomes a treasure trove of data about your business—data which is valuable and can be used for analysis and better decision-making.
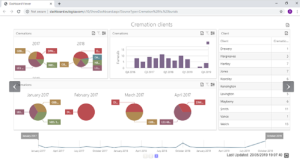
A dashboard is an information management tool that tracks and displays key performance indicators in a graphical manner, to monitor the health of a business. The Eulogica Dashboard can show not only data from last year or the previous month, but what is happening right now – and how it breaks down according to branches, products or other factors you wish to observe.
The Eulogica Dashboard provides real-time information. The moment a new funeral, invoice or other data is added to Eulogica, any dashboard views associated with the data will reflect the change.
As you would expect from Eulogica, dashboards can be configured according to your specific needs. It can give insight into, for example, the number of burials and cremations, revenues and profits, performance of branches, or popularity of products. Different managers in the same company can have different dashboards, reflecting their responsibilities.
While owners and managers normally have some understanding or intuition about where the business is heading—and accounting information is available for past periods—Eulogica Dashboard can ensure the most important information is clear, accurate, and always up to date.
In line with our belief that every Funeral Director is unique, you are the person to decide what information needs presenting by way of dashboard views. You might wish to have a chart indicating how many cremations are provided month by month, or how branch offices compare – while another manager perhaps takes more interest in details of transportation. We can configure Eulogica Dashboard accordingly.
Not only can a Eulogica Dashboard view show multiple charts or facts, but there can be multiple pages, suitable for swiping back and forth. The specific representation of the data is also for you to choose: Plain bar or stacked bar? Pie chart, line chart, or just good old sums, averages, and counters? Let us know what you wish to see, and the Eulogica Dashboard can usually accommodate it.
The Eulogica Dashboard can also be invaluable for weekly, monthly or quarterly management meetings. Any Dashboard view can be printed on paper—or why not put it up on a big screen for discussion!